Publication#
You can use this to cite our work, however, the actual information on how to use this package is contained in this readme and not in the mansucript.
Ollenschläger, M.; Küderle, A.; Mehringer, W.; Seifer, A.-K.; Winkler, J.; Gaßner, H.; Kluge, F.; Eskofier, B.M.
MaD GUI: An Open-Source Python Package for Annotation and Analysis of Time-Series Data. Sensors 2022, 22, 5849. https://doi.org/10.3390/s22155849
MaD GUI#
Machine Learning and Data Analytics Graphical User Interface
![]()
![]()


MaD GUI is a basis for graphical annotation and computational analysis of time series data. It gives easy access to plotted data / annotations and handles interaction with annotations for you in the background. Developers must create plugins and inject them into the GUI to read data of their format or use their algorithm.
This is still an early version. Things might not work as expected but we are happy to help!
Experiencing issues? Report a bug here!
click to enlarge the image
click images below to show videos on YouTube
(open video descriptions on YouTube for chapters)
Quickstart for developers#
In a python environment, execute the following commands or use the section Development installation:
pip install mad_gui
mad-gui
You can download our example data to test our built-in exemplary importer, exemplary algorithms and exemplary label. To see how to open our example data within the GUI, please refer to our section about the User Interface.
Contents of this readme#
Why and what?#
Existing graphical user interfaces (GUIs), that deal with time series data, usually do not allow support of annotation by algorithms, although such algorithms exist. If they do, the algorithm and the GUI are tightly coupled, such that reusing it becomes hard.
Furthermore, algorithms that were developed to analyze time series data, can usually not be used by researchers, who do not have programming experience, although the algorithms were developed for their research area. This is for example the case in the area of gait analysis, where algorithms are provided by computer scientists and need to be used by clinical researchers.
The MaD GUI can be used as a framework to incorporate algorithms for supporting time series annotation and for using algorithms for analyzing time series data even without having programming experience. You can read about this in more detail in our Background section.
Download / Installation#
Plugin Developers#
Please see the section Development installation.
GUI user: Standalone executable#
You do not need to install anything. Simply download the file from the table below for your regarding operating system. Afterwards you can start the GUI as described in the rightmost column of the table.
When downloading a file from the table, your browser may warn you that this is a potentially dangerous file. You will only be able to use our GUI by selecting "Keep anyway / download anyway / ...". In the case of Microsoft Edge, this possibility is hidden, but you can select it after downloading as explained here.
| Operating system |
File to download |
What to do |
|---|---|---|
| Windows | Windows (64 bit) | Download the file on the left. Then open the downloaded file and read about example data in the section below this table. Note: If prompted with a dialog Windows protected your PC, click More info and then select Run anyway. |
| Ubuntu | Ubuntu (64 bit) | Download the file on the left. Then, in your terminal, navigate to the file loaction and then: chmod +x ./mad_gui_ubuntu and then ./mad_gui_ubuntu. Note: you might need to install some additional packages. You can use this script to do so. Just right click the link, save it on your machine and execute it. |
| Mac OS | Mac OS (64 bit) | mad_gui.mad_gui and choose "New Terminal at Folder"sudo -xvf mad_gui.tgz and press return.Note: If your Mac does not allow you to open this file, perform the actions for "If you want to open an app that hasn’t been notarized or is from an unidentified developer" on the Apple Support Page. Afterwards, try to open it again as described above. |
| other | Supplied upon request | Contact us |
Example Data#
After clicking this link, you can download our example data by either using Ctrl+S on your keyboard or click the right mouse button and then select Save as... to save it on your machine.
Make sure to remember, where you save this file.
After starting MaD GUI, you can open the previously downloaded example data as shown in User Interface.
You want to load / display data of a specific format/system or want to use a specific algorithm? In this case please refer to Load and display data of a certain data type
You want to load / display data of a specific format/system or want to use a specific algorithm? In this case please refer to Load and display data of a certain data type
Terminology#
| Word | Meaning |
|---|---|
| Annotation | An annotation has a start and a stop value, e.g. it goes from second 1 to second 2 of the time series data. |
| Label | An annotation is always of a certain type, for example "Activity". These types are called labels. A Label keeps the possible descriptions of an annotation. For example, the label "Activity" can have the descriptions "walk" or "run". Furthermore, it keeps information about where the annotation should be plotted, e.g. lowest 20% of the plot. |
| User | Someone who performs actions in the GUI using the mouse and keyboard. |
| Developer | Someone who creates plugins for the GUI, for example to load a specific data format or to use a specific algorithm. |
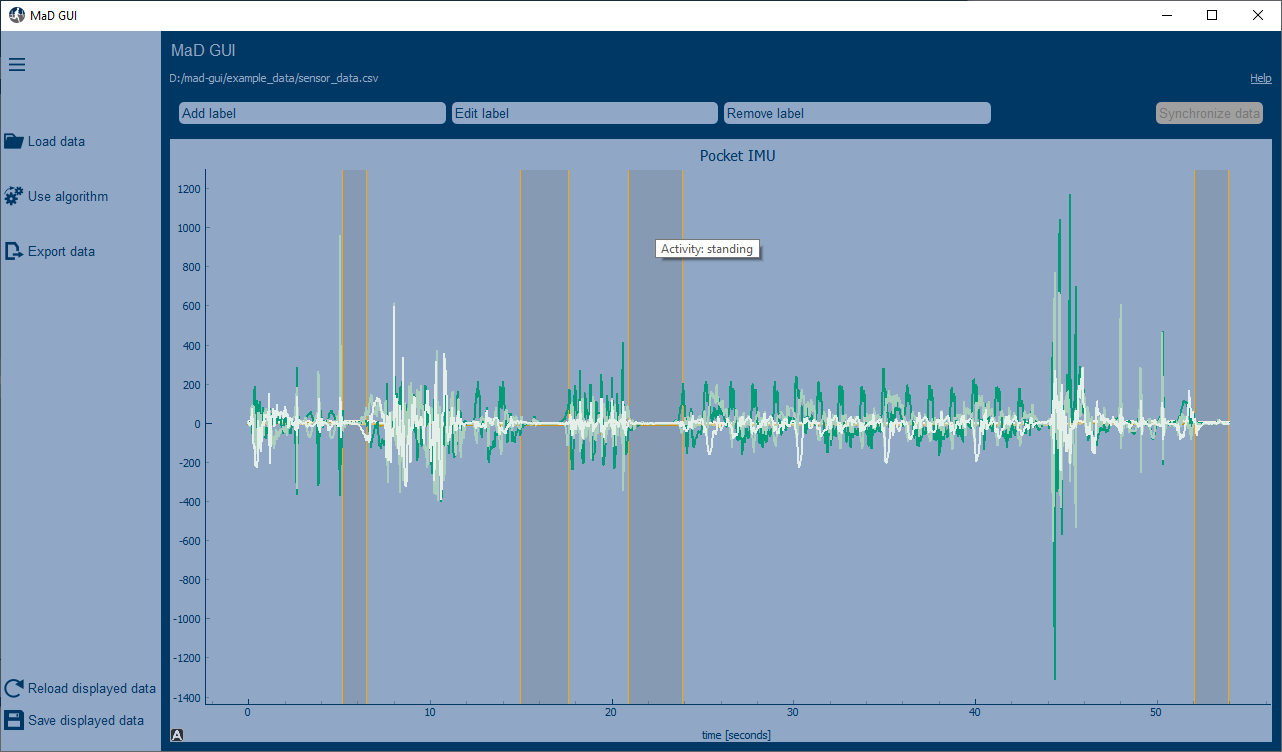
User Interface#
You can get information on how to use the GUI from the keywords below or from the video referenced in each of the sections. You may also want to take a look at ACQ4 documentation to learn about mouse interaction with the plots (e.g. zooming).
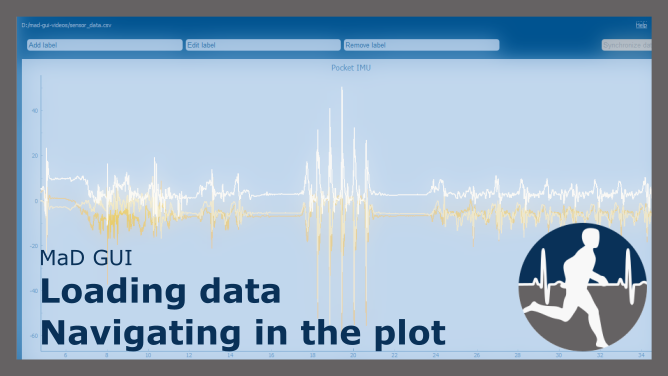
Load data#
| Text | Exemplary Video |
|---|---|
Load data button on the leftSelect data file to specify the sensor data to be loaded(do not confuse with Use Algorithm, see below.) Start |
|
Use algorithm#
Passes the currently displayed data to an algorithm, which then calculates new annotations or features for existing annotations.
| Text | Exemplary Video |
|---|---|
Use algorithm button on the leftStart processing |
|
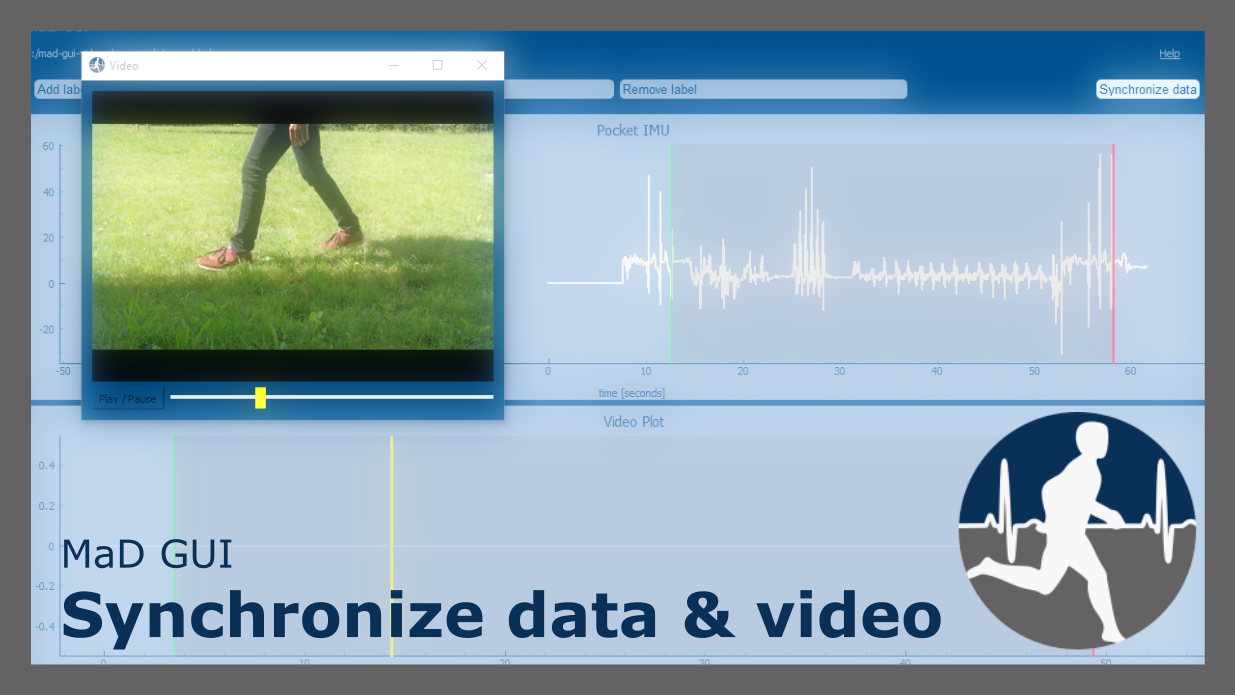
Synchronize sensor data and video#
Please watch the video:
Export data#
Exports displayed annotations into an excel file.
If you want to export displayed sensor data, either use the Save displayed data button.
If you want to customize exports, please create an Exporter.
Shortcuts#
Please watch the videos linked above, if you want to learn more about the different actions.
| Shortcut |
Mode |
Action |
|---|---|---|
a, e, r, s, Esc |
all | Switch between modes Add label, Edit label, Remove label, Synchronize data |
Left Mouse Click |
Add label | Set start/end of a label |
Space |
Add label | Can be used instead of Left Mouse Click |
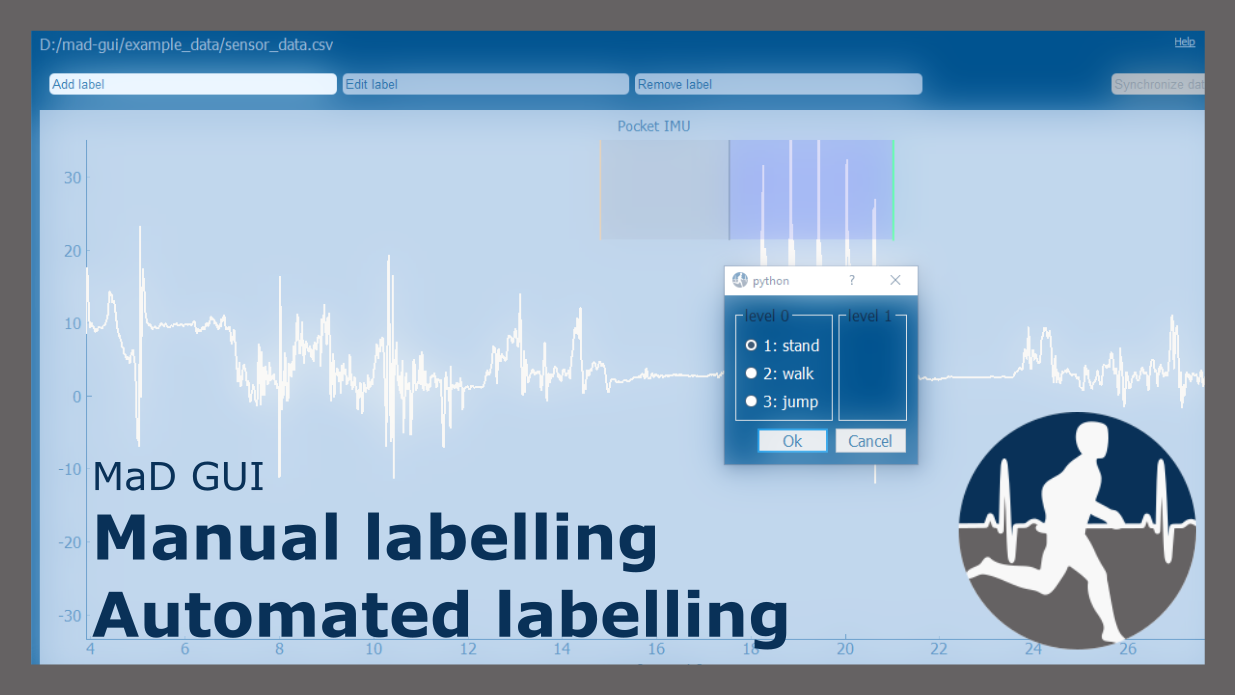
1, 2, 3,... TAB |
Add label | Navigate in the pop-up window |
Shift + Left Mouse Click |
Add label | Start a new label directly when setting the end of a label |
Ctrl + Left Mouse Click |
Add label | Add a single event |
Load and display data of any format#
This will need someone who is familiar with Python, who has to develop a plugin of the type Importer.
For more information on how to create plugins, please refer to Developing Plugins.
You do not have experience with python but still want to load data from a specific system? Contact us!
Use a custom algorithm#
This will need someone who is familiar with Python, who has to develop a plugin of the type Algorithm.
For more information on how to create plugins, please refer to Developing Plugins.
You do not have experience with python but still want to load data from a specific system? Contact us!
Development#
In case you experience issues, please try to find a solution in our documentation regarding Troubleshooting.
Development installation#
Info: We recommend to use pip install mad_gui in a
clean python 3.8 conda environment, or if you know what you are doing in a python venv.
.
pip install mad_gui
Then, from your command line simply call:
mad-gui
Alternatively, within a python script use our start_gui function:
from mad_gui import start_gui
start_gui()
If you want to see an example, download our example data. Afterwards, you can open the previously downloaded example data as shown in User Interface. You want to load data of a specific format/system or want to use a specific algorithm? In this case please refer to the sections Load and display data of a certain data type and Use a custom algorithm.
Developing plugins#
The MaD GUI package can be extended with different kinds of plugins and labels. The user can access your plugins within the GUI using dropdowns, after clicking "Load data" or "Use algorithm". However, this is only possible if your plugin was passed to the GUI at startup, as we show it for an importer in this GIF, or as shown in this code snippet:
from mad_gui import start_gui
from my_importer import MyImporter
from my_algorithm import MyAlgorithm
from my_labels import MyFirstLabel, MySecondLabel

# only passing plugins
start_gui(plugins=[MyImporter, MyAlgorithm])

# passing plugins and labels
start_gui(plugis=[MyImporter], labels=[MyFirstLabel, MySecondLabel])
In the sections in the following list we describe how you can develop your own plugins and labels, which must inherit one of our base plugins or BaseRegionLabel. Each of these sections keeps working example to get you started as quick as possible:
Importer: Load and display data of any format
Algorithm: Create annotations for plotted data
Algorithm: Calculate features for existing annotations
Exporter: Export displayed annotations
For supplementary basic information please refer to Preparation.
Communicating with the user#
Pop-up#
If - at any point - you want to send a message to the user of the GUI, you create a message box with an OK button like this:
from mad_gui.components.dialogs.user_information import UserInformation

UserInformation.inform_user("Your message")

# will return PySide2.QtWidgets.QMessageBox.Yes or PySide2.QtWidgets.QMessageBox.No
yes_no = UserInformation().ask_user("Yes or No?")
Tooltip of labels#
You can display results of your algorithms for example by putting the results into the label's description as shown in our section about custom algorithms.
Adjusting Constants#
You can create your own settings by creating a class, which inherits from our BaseSettings. The following example makes use of the BaseSettings and simply overrides some properties:
from mad_gui.config import BaseSettings
from mad_gui import start_gui

class MySettings(BaseSettings):
    # decide which axes/channels should be plotted by default
    # Note that this will result in an error if the passed data does not have those axes
    CHANNELS_TO_PLOT = ["acc_x", "acc_z"]

    # used if a label has `snap_to_min = True` or `snap_to_max = True`
    SNAP_AXIS = "acc_x"
    SNAP_RANGE_S = 0.2

    # in all your labels you can add an event by using `Ctrl` as modifier when in `Add label` mode
    # when adding an event the user will be prompted to select one of these two strings as a
    # `description` for the event
    EVENTS = ["important event", "other type of important event"]

    # Set the width of IMU plot to this, when hitting the play button for the video.
    PLOT_WIDTH_PLAYING_VIDEO = 20  # in seconds

    # If plotting large datasets, this speeds up plotting, however might result in inaccurate
    # representation of the data
    AUTO_DOWNSAMPLE = True

start_gui(
settings=MySettings,
)
Changing the theme#
You can easily change the two dominating colors by passing your own theme to the GUI.
   from mad_gui import start_gui
   from mad_gui.config import BaseTheme
   from PySide2.QtGui import QColor

   class MyTheme(BaseTheme):
      COLOR_DARK = QColor(0, 255, 100)
      COLOR_LIGHT = QColor(255, 255, 255)

   start_gui(
    theme=MyTheme,
   )
Support & Contributing#
You can find some help in our section about troubleshooting. In case you can not solve an issue using that section, please get in touch.
Background#
User perspective#
The challenge#
New algorithms for analyzing time series data are published frequently. However, the developed algorithms can hardly be used if the area of application is outside of computer science. For example in clinical research, the user likely will lack necessary programming expertise.
Best available solutions#
Many graphical user interfaces exist, that allow interaction with time series data without programming expertise.
Usually they can be used to annotate sequences of a signal, resulting in information like
"from timestamp x to timestamp y, z happend" or "at timestamp x, z happened".
In case they need a more detailed analysis using a specific kind of algorithm, usually the data has to be sent to
the developer of the specific algorithm, who has to process it and send back the results.
Limitations of available solutions#
If available graphical user interfaces contain algorithms, these tools are often not open-source and/or require the user to install software on their machine. The latter is not always easily possible due to restrictions of an institution's security policy. In case an algorithm is not incorporated into a graphical user interface, the user interested in using this algorithm would have to send data to developers of the specific algorithm. This may be undesirable for several reasons. Among others, data protection laws and the created overhead are important aspects.
As a result, many algorithms are developed to support research fields outside of computer science, as for example clinical research, but can hardly be used.
Our solution#
The MaD GUI offers an easy way of accessing algorithms for the analysis of time series data. This enables researchers to make use of state-of-the-art-algorithms for time series analysis in their respective research area even if they do not have programming expertise.
Developer perspective#
The challenge#
Researching algorithms for time series data in many cases requires annotation of data. To accomplish the task of annotation, developers usually need some kind of graphical user interface.
Best available solutions#
While many graphical user interface exist for annotating time series data, they usually do not incorporate algorithms, which could support the developer with labelling the data - and they do not offer an interface to add algorithms. However, many algorithms exist for such kind of support.
Limitations of avaialable solutions#
In case a graphical user interface incorporates algorithms to support labelling, these are often very specific to the use-case. This results in each developer building their own graphical user interface, which usually is not developed with the aim of being modular or to be used in other projects. Therefore, there is a lot of work done over and over again.
Our solution#
The MaD GUI offers a basis for such scenarios. It can be extended by developers to load their specific data format. Furthermore, developers can easily inject their algorithms to support labelling or analyze time series data as a plugin. In addition, developers can specify the labels to be used - it could be one layer (= one label from top to bottom) or an arbitrary amount of layers, (e.g. use one kind of label in the upper part of the plot and another kind of label in the lower part of the plot). During annotation, each label can easily be assigned an additional description to add details to the specific annotation.