1 Labels#
1.1 Creating a Region Label#
Labels can be used to create annotations in the GUI. You can create your own label, which must inherit BaseRegionLabel, like this:
from mad_gui.plot_tools.base_label import BaseRegionLabel
from mad_gui import start_gui

class Status(BaseRegionLabel):
   # This label will always be shown at the lowest 20% of the plot view
   min_height = 0
   max_height = 0.2
   name = "Anomaly Label"

   # Snapping will be done, if you additionally pass a Settings object to the GUI,
   # which has an attribute SNAP_AXIS. See the README, the part of Adjusting Constants
   # for more information
   snap_to_min = False
   # snap_to_max = False  # if setting this to `True`, set `snap_to_min` to `False` or delete it

   # User will be asked to set the label's description when creating a label.
   # This can have an arbitrary amount of levels with nested dictionaries.
   # This es an example for a two-level description:
   descriptions = {"normal": None, "anomaly": ["too fast", "too slow"]}
Using your algorithm in the GUI
You need to pass the label class (and optionally other plugins) to the start_gui function, see Readme: Developing Plugins.
The description defines the possible strings that can be assigned to a label. They will automatically show up after adding a new label or by clicking on a label when in Edit label mode, such that the user can select one of the descriptions. In our exemplary video, this is {"stand": None, "walk": ["fast", "slow"], "jump": None}.
1.2 Creating an Event Label#
This kind of events can be plotted in the GUI, when the user uses Ctrl + LeftMouseClick/Space. See the above section for more infos on class attributes, and our exemplary video for more information on labelling.
class MyEvent(BaseEventLabel):
    min_height = 0
    max_height = 1
    name = "Peak"
    descriptions = {"Positive peak": None, "Negative peak": None}
    snap_to_min = False
    snap_to_max = False
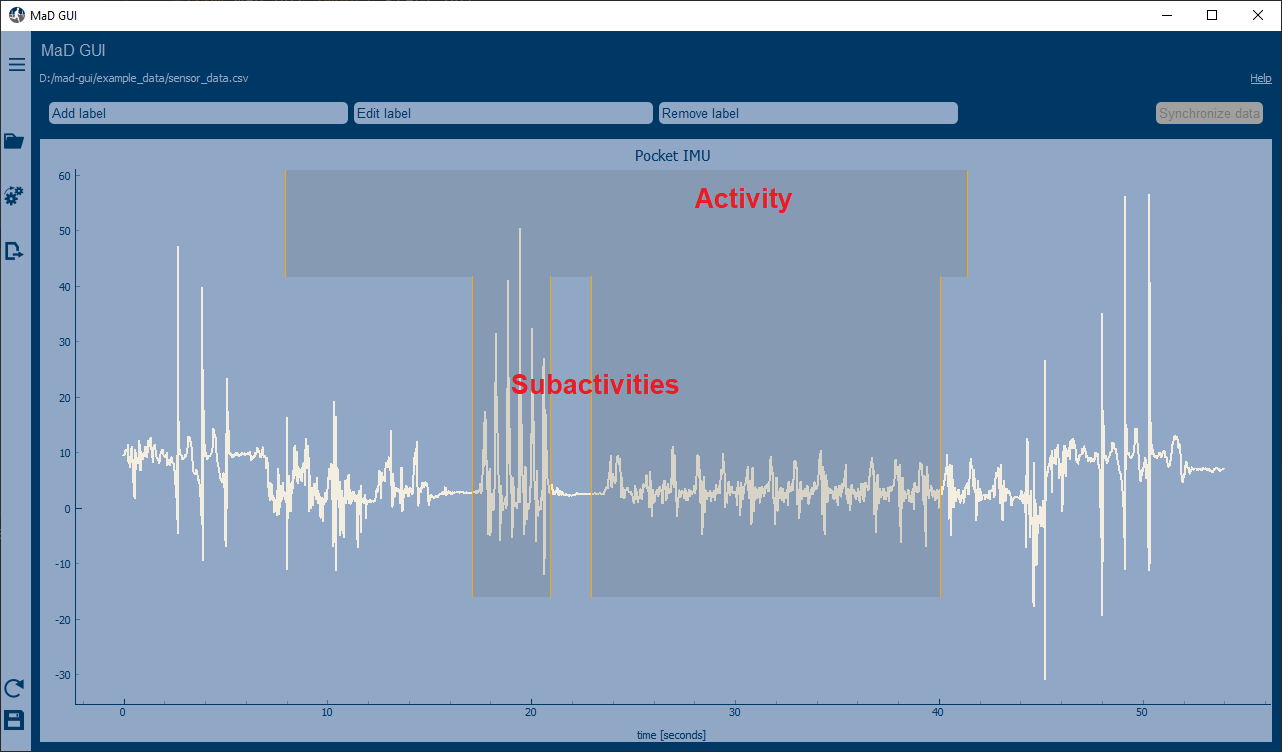
1.3 Using more than one category of labels#
You can also pass several labels to the GUI. See the image below the code snippet to find out, what kind of annotations can be created with these label classes:
 from mad_gui.plot_tools.labels.base_label import BaseRegionLabel
 from mad_gui import start_gui

 class LayerOne(BaseRegionLabel):
    # This label will always be shown at the upper 20% of the plot view
    min_height = 0.8
    max_height = 1
    name = "Activity"
    # description = see first code snippet on this page

 class LayerTwo(BaseRegionLabel):
    # This label will always be shown at the lowest 20% to 80% of the plot view
    min_height = 0.2
    max_height = 0.8
    name = "Sub-Activity"
    # description = see first code snippet on this pag

start_gui(labels=[LayerOne, LayerTwo])